The Number Kingdom
The Graph Garden
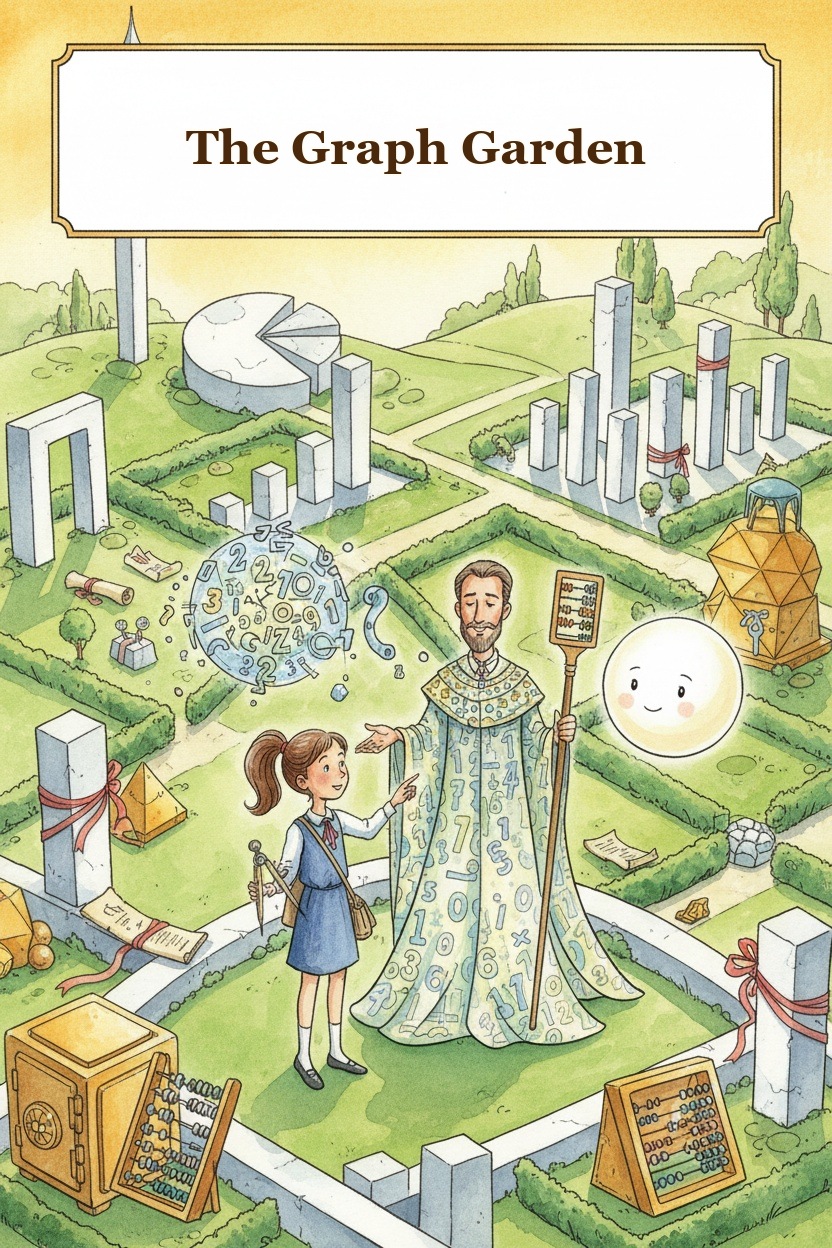
The Garden That Lost Its Shape
Mira arrived at the Graph Garden with her satchel bouncing against her hip and her golden compass spinning steadily in her palm. The garden was famous throughout the Number Kingdom—a place where flowers grew in mathematical patterns so precise that the whole garden formed one enormous living picture when viewed from above.
But when Mira reached the garden gate, she stopped cold.
"Right. Let's see what's broken," she said quietly.
The garden looked like a puzzle that had been shaken. The tulips that should have stood in orderly rows now scattered themselves like dropped marbles. The rose bushes that should have climbed in gentle arcs had collapsed into tangled knots. The fountain at the garden's heart—which should have been framed by perfectly spaced daisies—stood alone and bare.
The Count stood beside the gate, his numeral-covered robes shifting restlessly. "The Graph Garden is maintained by data," he explained. "Each flower bed corresponds to a coordinate graph. The gardeners plant according to what the data describes—bar graphs for the tulip terraces, line graphs for the rose paths, scatter plots for the daisy fields."
He gestured at the chaos before them. "The Remainder has scrambled all the data. The gardeners are planting from graphs that are wrong—correct numbers on incorrect axes, points plotted where they should not be, graphs of one type switched for another. And so the garden has collapsed."
Nearby, a small patch of air shimmered. The Remainder appeared, shaped this time like a lopsided watering can with a spout that dripped sparkling numbers.
"Isn't it BEAUTIFUL?" it said, spinning in a circle. "I simply moved things around! A little number here, a little number there—who says a seven must go where a seven was before? Why must the data sit in its proper PLACE? The garden was too tidy. Too predictable. I made it INTERESTING."
Mira squinted at the garden. The tulips had been planted in what looked like clumps of four and five, with no order she could see. The rose bushes wandered in aimless curving lines. The daisies were scattered everywhere with no pattern at all.
"Interesting might be one word for it," she said. "I'd probably choose 'messed up.'"
The Remainder giggled and disappeared in a puff of confetti.
The Tulip Terrace and the Bar Graph
Mira walked to the tulip terrace first. Beside it stood a large slate board, tilted at an odd angle, with marks scratched across it. The gardeners—small, worried-looking people with trowels and watering cans—clustered around her.
"These are our instructions," one gardener said, pointing at the slate. "But look what's happened."
Mira studied the slate. It showed a row of boxes with numbers beneath them.
[drawing of a bar graph with bars of different heights, but the labels are wrong]
"One box says 'five tulips' but the bar for it is short," the gardener continued. "Another says 'three tulips' but its bar is the tallest one on the board."
Mira pulled out her notebook and pencil. "Okay," she said. "So a bar graph shows information using bars of different heights. The height of each bar matches the number it represents. If the bars are right but the labels are wrong, the gardeners will plant the wrong amount."
She looked at the slate more carefully. "The problem isn't the numbers themselves. The numbers are fine. The problem is that the bars and the labels have been separated. The Remainder didn't change the amounts—it changed which amount went with which label."
She drew a quick sketch in her notebook:
Draw a bar graph with labels for Tulip Types: Red, Yellow, Orange, Pink. Bars should be: Red = 8, Yellow = 5, Orange = 3, Pink = 6.
"Hmm," Mira said. "But I don't know the original data. I only know what the raw numbers are."
She read the numbers from the slate: 3, 5, 6, 8.
"That's all I have," she said. "Three, five, six, eight. Without knowing which number belongs to which color, I can't rebuild the bar graph."
She sat down on the garden path and looked at the tulips. There were red tulips, yellow tulips, orange tulips, and pink tulips. They were all mixed together in messy clumps.
"Wait," she said slowly. "The tulips are already planted. They were planted from the scrambled data. So if I count the tulips that are actually here, I'll know how many of each color were planted—and then I can work backward to figure out which number the Remainder assigned to each color."
She knelt and began counting. It took a while, but Mira was patient.
"Eight red tulips," she said. "Five yellow. Three orange. Six pink."
She wrote this down. "Now I have the raw data. I know how many of each tulip color should be in the garden. But the original bar graph had specific labels and specific heights. If the Remainder swapped the labels around, I need to figure out the original pairing."
She looked at the slate again. The bars were labeled Red, Yellow, Orange, and Pink, but with numbers that didn't match the actual tulip counts.
"The bar that says Red is only three high," she said. "But there are eight red tulips. So that's wrong."
She tried a different approach. "What if I just put the correct numbers with the correct colors, and replant the tulips in the pattern the correct graph describes?"
She drew a new bar graph in her notebook, with Red = 8, Yellow = 5, Orange = 3, Pink = 6, and double-checked that the heights matched the numbers.
"Here," she said, showing the gardeners. "Plant according to this."
The gardeners set to work, digging up the misplaced tulips and replanting them in the order the new bar graph described. Mira watched as the terrace transformed. The bars weren't just a drawing on a slate—they were a planting pattern. Where the bar graph showed a tall red bar, there was a solid block of red tulips. Where it showed a short orange bar, there was a small cluster of orange.
"It's not just about having the right numbers," Mira murmured to herself. "It's about matching the graph to the data. The graph is a picture of the data. If the picture is wrong, the garden is wrong."
The Rose Path and the Line Graph
The rose path was next. The bushes were arranged in a curving line that twisted back on itself, making a shape Mira couldn't quite understand.
Beside the path stood another slate. This one showed a drawing of a line that jagged up and down in seemingly random directions.
[drawing of a line graph with points connected, but the points are out of order, causing the line to zigzag]
A gardener wrung her hands. "The line graph shows how tall the rose bushes should be at each position along the path," she said. "But the points on the graph are all scrambled. The line connects them in the wrong order, so the bushes were planted at the wrong heights."
Mira looked at the slate. The line graph had labeled points with numbers—1 through 7—and heights marked on the side. But the line was drawn as a jagged zigzag, pointing up and down unpredictably.
"I need to understand what a line graph should look like," Mira said. "A line graph shows how something changes across an order—like time, or position. Each point has a spot on the horizontal line and a value on the vertical line. You plot each point where it belongs, and then you connect them in order."
She looked at the graph more carefully. "The points are all there, but they're connected in the wrong order. The line is going from point 3 to point 7 to point 1, instead of 1 to 2 to 3."
She started plotting the points in order in her notebook:
Draw a line graph with points at: (1, height 2), (2, height 3), (3, height 5), (4, height 6), (5, height 5), (6, height 4), (7, height 2). Label axes: Position (1-7) and Height.
"See," she said to the gardener, showing her the notebook. "Each position has one height. When I plot them correctly, the line shows a gentle rise and fall—the rose bushes should be short at the start, tallest in the middle, and short again at the end."
She paused. "But let me check my work. Position 1 has height 2. Position 2 has height 3. Position 3 has height 5—"
She frowned. "Wait, that doesn't look right. Let me read the numbers again."
She examined the slate more closely. The data points were listed at the bottom:
1 → 2
2 → 5
3 → 3
4 → 6
5 → 5
6 → 4
7 → 2
"Oh," Mira said. "I misread the data. Position 2 has height 5, not 3. Let me redo the graph."
She plotted the points again:
Draw a corrected line graph with points at: (1, 2), (2, 5), (3, 3), (4, 6), (5, 5), (6, 4), (7, 2)
"Now it shows a different pattern," she said. "Up, down, up, down, down, down. Not as smooth, but it's the truth of the data. The graph has to match what the data says."
The gardeners planted the rose bushes according to her corrected graph. The path now rose and fell in a pattern that matched the line exactly.
"A line graph tells a story," Mira said, mostly to herself. "But only if the points are plotted at the right positions and connected in the right order. Mix up the order, and the story becomes nonsense."
The Daisy Field and the Scatter Plot
The daisy field was the last to fix, and it was the strangest. The daisies were scattered across the field with no pattern at all—some clustered together, others spaced far apart, a few growing in places that seemed like they should be the middle of the path.
The slate beside the field showed a scatter plot—a set of dots with no connecting line.
[drawing of a scatter plot with points scattered randomly, above and below a diagonal line]
"This one is a scatter plot, isn't it?" Mira said. "Each point is just a point. There's no line connecting them. So what's wrong with it?"
A gardener pointed at the field. "A scatter plot shows two measurements for each thing," he said. "For the daisies, each one has a height and a width. We plant the daisy at the position where those two measurements meet."
Mira studied the slate. The scatter plot showed dots scattered across the grid. The axes were labeled "Height" and "Width."
"The dots are all here," Mira said. "But the axes have been swapped. The Remainder switched the labels on the axes, didn't it?"
She looked closer. The data clustered along a diagonal line—the taller the daisy, the wider it was. But the labels were crossed, so the gardeners had been planting by the right numbers on the wrong axes.
"Height and width are related," Mira said. "Taller daisies are also wider. That's what the scatter plot shows—a pattern of points that go up and to the right together."
She drew the scatter plot correctly in her notebook:
Draw a scatter plot with a positive correlation between height and width. Label axes correctly: X-axis = Width, Y-axis = Height. Points roughly follow a diagonal line upward from bottom-left to top-right.
"There," she said. "Now the pattern makes sense. When you look at a scatter plot, you're not looking for a single correct line. You're looking for the shape of the data. Do the points go up together? Down together? Or is there no pattern at all?"
She looked at the field. "And the shape of the data determines the shape of the garden."
The gardeners replanted the daisies according to the corrected scatter plot. When they finished, the field showed a beautiful diagonal drift of flowers—each daisy getting taller and wider as the planting progressed across the field.
Mira stepped back and looked at the whole garden from the hill above it.
The tulip terrace showed a row of clean bars—blocks of color in heights that told the story of the data. The rose path rose and fell in the exact pattern of the line graph. The daisy field showed a gentle diagonal wave, like a tide of flowers.
The garden was beautiful again. But it wasn't just beautiful—it was meaningful. Every flower was in its place because the data said it should be there.
The Data Tells a Story
"I never knew graphs could be gardens," Mira said.
Zero appeared beside her, small and silver-white, taking up no space but somehow filling it. "Graphs are pictures of data," Zero said quietly. "Data is information. And information can grow anything—even flowers."
The Remainder shimmered into existence at the edge of the field. It looked at the restored garden with its head tilted.
"I don't understand," it said, and for once it sounded genuinely puzzled. "I put the numbers in NEW places. I made the graph DIFFERENT. Why is the garden better now?"
Mira thought about this. "Because a graph doesn't exist to be different," she said. "It exists to tell the truth about the data. If the graph is wrong, the truth is hidden. The garden is beautiful because it's honest."
The Remainder considered this. "And what about the parts that DON'T fit neatly?" it asked. "What about the points that don't follow the pattern? The scatter plot had points that were higher than the line. The line graph had a point that didn't fit the shape. Those are the remainders. Those are the parts that don't divide evenly."
Mira opened her mouth to argue—and then stopped.
Actually, that was true. Not all the daisies fit the diagonal pattern perfectly. A few were taller and narrower than the trend. A couple of rose bushes weren't quite the height the line graph predicted.
"You're right," she said. "No data is perfect. Graphs show the pattern, but there's always variation around it. That's not a mistake. That's part of what the data is."
The Remainder's face brightened. "So I was HELPING?"
"You were making it messier," Mira said. "But the mess was also real. It just needed to look like a pattern with variation, not chaos."
The Remainder tilted its watering-can body, then nodded slowly. "I think I understand. The pattern is the story. The variation is the detail. Both matter."
It vanished, leaving behind a trail of sparkling dust.
Zero said nothing, but Mira could feel it watching the garden contentedly.
"All right," Mira said. "Let me check the other graphs." She walked through the garden, counting tulips, measuring rose bushes, and squinting at the daisy field. Everything matched now. The bar graphs matched their counts. The line graph matched the path. The scatter plot matched the field.
She returned to the slate boards and noticed something odd—they all had coordinates labeled at the corners. The graphs were all placed on coordinate grids, with x and y axes marked.
"The labels are all on the right axes now," she said. "The bar graph has categories on the x-axis and counts on the y-axis. The line graph has position on the x-axis and height on the y-axis. The scatter plot has width on the x-axis and height on the y-axis."
She stepped back and looked at the garden again. "That's what makes it work," she said. "Every graph needs to know what its axes mean, and which data goes where. Put the wrong data on the wrong axis, and the picture lies."
"Indeed," said the Count, who had been watching from the gate. "The choice of graph type also matters. Bar graphs compare categories. Line graphs show change across an order. Scatter plots show the relationship between two measurements. Choosing the wrong type—or plotting the right data on the wrong axes—destroys the information entirely."
Mira nodded. "A graph is only as good as how well it shows the data," she said. "And the data is only as good as whether the graph tells its story truly."
Zero drifted to the center of the garden, where the fountain stood. The daisies around it had been planted in a perfect circle, with the scatter plot's pattern flowing outward in a wave.
"There is one more thing," Zero said quietly. "The origin. Where the x and y axes meet. It has coordinates (0,0). Every measurement starts from there. Every distance is measured from that point."
The gardeners had planted a single white daisy at the very center of the fountain circle—the point where the axes crossed.
"Zero," Mira said, "that's you."
Zero nodded once, small and silver-white. "Yes. Every graph needs a place where measurement begins. Without (0,0), there is no reference. No baseline. No direction."
"Interesting," said the Count. "I had always thought of the origin as merely the starting point. Not as something requiring attention."
Zero said nothing. It simply drifted away, a quiet silver coin vanishing into the garden's beauty.
Mira looked at the garden one more time. The tulip bars stood in blocks of color. The rose path curved in its truthful pattern. The daisy field showed its diagonal story, with a single white daisy at the center where everything began.
"Right," she said happily. "Now this is a garden that tells the truth."
Zero's voice drifted back through the flowers: "Yes. That tends to work."